


Index Replication using Individual Stocks with periodic rebalancing: Part 1

Investing in indices or ETFs has long been a strategy to minimize the idiosyncratic risk associated with single stocks. In this article, we’ll explore the nuances of achieving returns similar to an index by utilizing a selected basket of individual stocks.
This series of articles will start with foundational concepts and progressively build toward more advanced replication strategies.
Problem Statement
Given a sector index and a set of stocks (ideally from the same sector), we aim to replicate the index’s returns using quantitative techniques applied to a basket of individual stocks.
For this illustration, let’s consider XLF (SPDR – Select Financial Services ETF).
Individual Stocks:
JPM (JP Morgan & Chase),
BAC (Bank of America),
C (Citigroup),
WFC (Wells Fargo),
GS (Goldman Sachs)
AXP (American Express)
BRK-B (Berkshire Hathaway – B Shares)
MS (Morgan Stanley)
Assumptions:
· No transaction costs
· Long-only positions allowed
· Cash does not have any returns (and correspondingly poses no risk)
Replication Strategy Assumptions:
Periodic Rebalancing: Rebalancing is performed twice a month—on the first and third Wednesday. If the scheduled date falls on a non-trading day, rebalancing is shifted to the next business day.
Flexibility: Positions can be held in stocks or cash.
Random Start Date: Initial evaluation starts from an arbitrarily chosen date.
Data Sources:
As a part of the replication strategy example, we will pull in the historical price data in Python using the yfinance library.
Approach:
The primary objective is to replicate index returns by calibrating the weights of stocks in the basket. Mathematically, the problem can be articulated as:
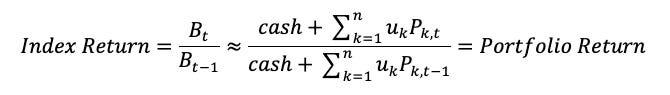
In the above equation, the left hand side represents the Benchmark (Index) return between 2 consecutive time steps.
The right-hand side, signifies the overall return of the basket where u represents the number of units held in the kth stock. Furthermore, note that some amount can be held in cash. Lastly, Pk,t represents the price of the kth stock at time t and correspondingly Bt represents the price of the benchmark index at the same point in time.
In an ideal scenario, we’d like to exactly match the LHS and the RHS, but given idiosyncrasies of stocks & the overall index, this is not feasible. Hence, we try to optimize the number of units held by trying to minimize the difference between the Index Returns and the Portfolio Returns over a historical period (as highlighted below).
The constraints on the optimization are as follows:
No short stock holdings (Long-only portfolio)
Cash balance cannot go negative (no borrowing allowed to make investments)
Regression Framework: Solve for optimal units (u) to minimize the mean squared error (MSE) between basket returns and index returns over a historical window of 22 trading days (~1 month). Note, the historical period of 22 days is an arbitrary choice.
The initial level of the portfolio/basket is picked arbitrarily (to figure out the initial set of stock units to be held).
Now, we need to choose the units across the basket, so that we can closely replicate the index returns over a given period. To find the best weights we run an optimization using scipy.optimize to minimize the mean-squared error over all the historical trading days:

The above error represents how closely the portfolio returns are tracking the benchmark.
Basic Example Scenario:
Let’s consider simply running a basket, with rebalancing on every 1st & 3rd Wednesday of a month with the aim to replicate XLF using the following list of stocks:
JPM, BRK-B, GS, AXP, BAC, WFC, MS
The evaluation metrics for the replication strategy are highlighted below:
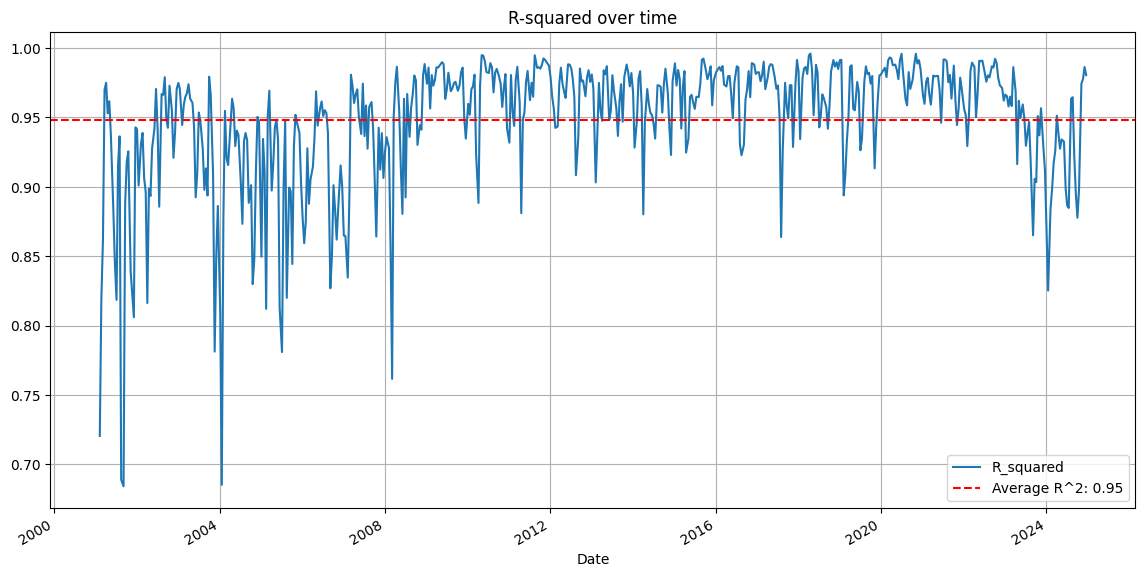
As a first investigation, we will showcase the R-Squared (associated with the fit) for each of the periods which are used to rebalance the portfolio. To be specific, this R-Squared value represents how closely the combination of the weights have replicated the portfolio (over the 22-day historical period).
On an average, the R-squared is about 95%. This shows that the replication is quite close to the index performance.
We’ll also see the cumulative performance of the index vs the basket (in the chart below).

An additional aspect to observe as we go about rebalancing the portfolio is the overall turnover of the portfolio, at every point you rebalance it. Turnover can be defined mathematically as follows:

That is the absolute difference in weights across all the underlying assets utilized to replicate the index. In the above equation, P is the avg price of the ith asset & V is the average value of the overall portfolio (during the period around rebalancing). The turnover represents the fractional changes to the holdings in every period to maintain the portfolio to track the benchmark consistently.

Above chart showcases how the turnover (Avg Turnover per re-balance~ 49%) evolves over time for the above replication strategy.
Observations & Open Questions:
While this framework seems to effectively replicates the index, it raises several critical questions:
Is it better to replicate an index with single stocks than to invest directly in the index itself?
How do transaction costs, driven by turnover, impact net returns? Should turnover feature in the optimization framework?
Is there an opportunity to invest unused cash strategically for better returns, and what risks accompany such approaches?
Some of these questions will be explored in subsequent articles within this series.